Prerequisite
You need at least one table with rows before a dashboard is useful. Set that up first, then come back here.
Ask your agent to build a view over your data:
text
Create a dashboard to show my language learning progress — total study time, vocabulary count, and my recent sessions.The agent calls add_widget for each stat, pointing every widget at a saved query or aggregation. The result updates live every time a new row is written.
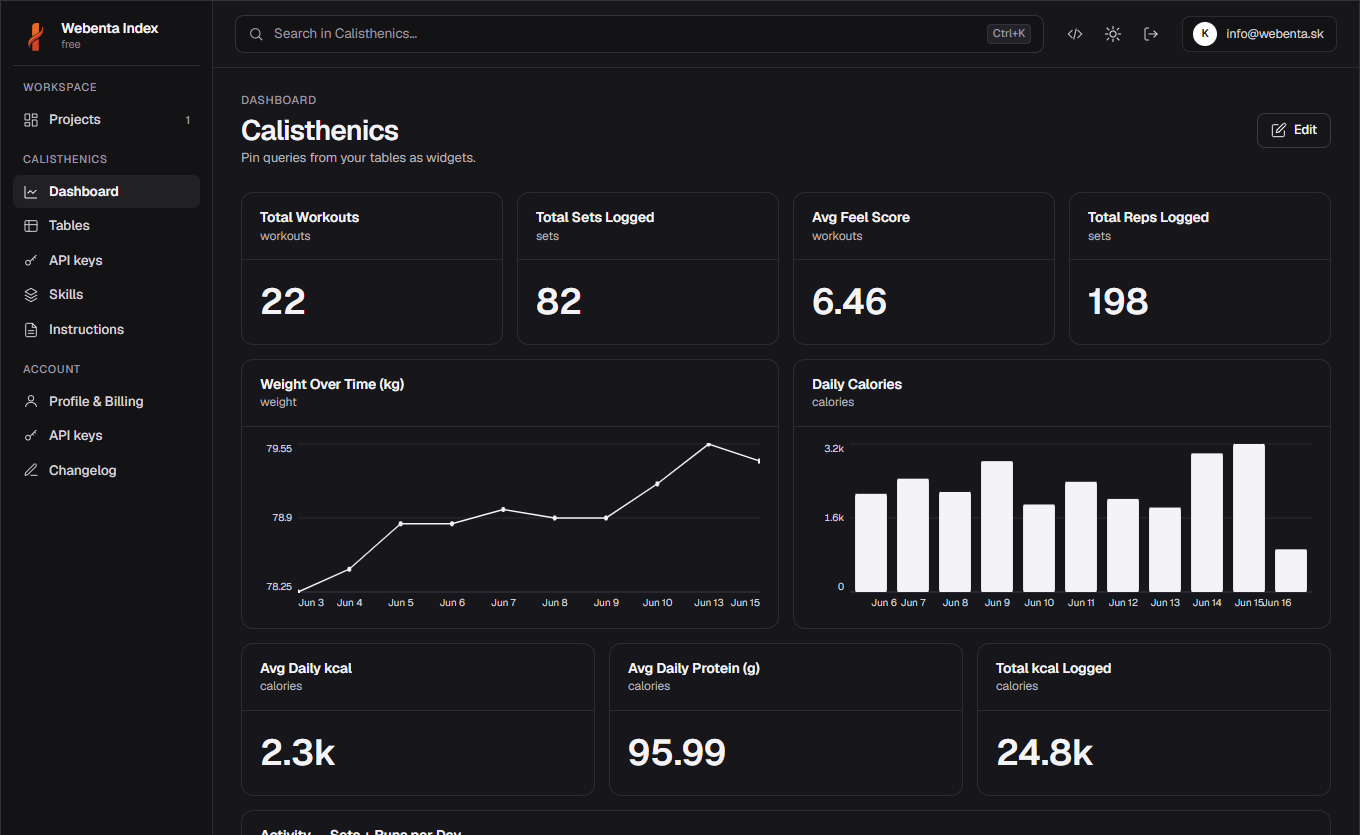
#Widget types
- Number — a single big stat, great for totals and streaks.
- Bar / Line — time series or category breakdown.
- Table — raw rows with sorting, useful for a quick recent-activity feed.
You can also edit manually
Open Dashboard → Edit → Add widget to build or tweak widgets yourself — pick a table, choose a metric, done.